SUU Biannual Employee Injury Report – January to July 2017
This report was created using the data collected by the SUU Accident Reporting and Investigation Procedures and the Workers Compensation Fund. Visit our webpage to learn more about the SUU Accident Reporting and Investigation Procedures.
During the months of January to July 2017, there have been a total of 19 work related injuries at Southern Utah University. Most of the injuries were caused by improper use of machinery, lack of safety training, and problems in task steps.
The purpose of sharing this report is to help SUU employees be aware of the common injuries here at Southern Utah University. We will also show you how you can get involved with campus safety programs so you can be a part of helping us achieve our goal of having an Injury Free Campus.
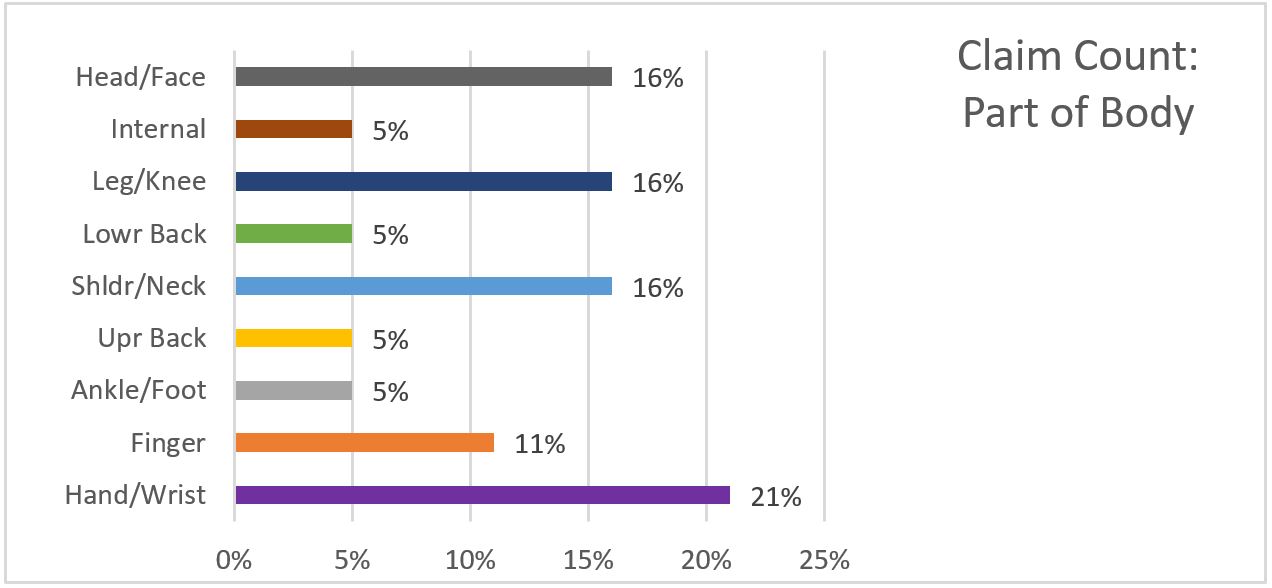
The graph above indicates that about 21% of all injuries were on the hand and wrist. The next largest groups were head/face, shoulder/neck and leg/knee injuries.
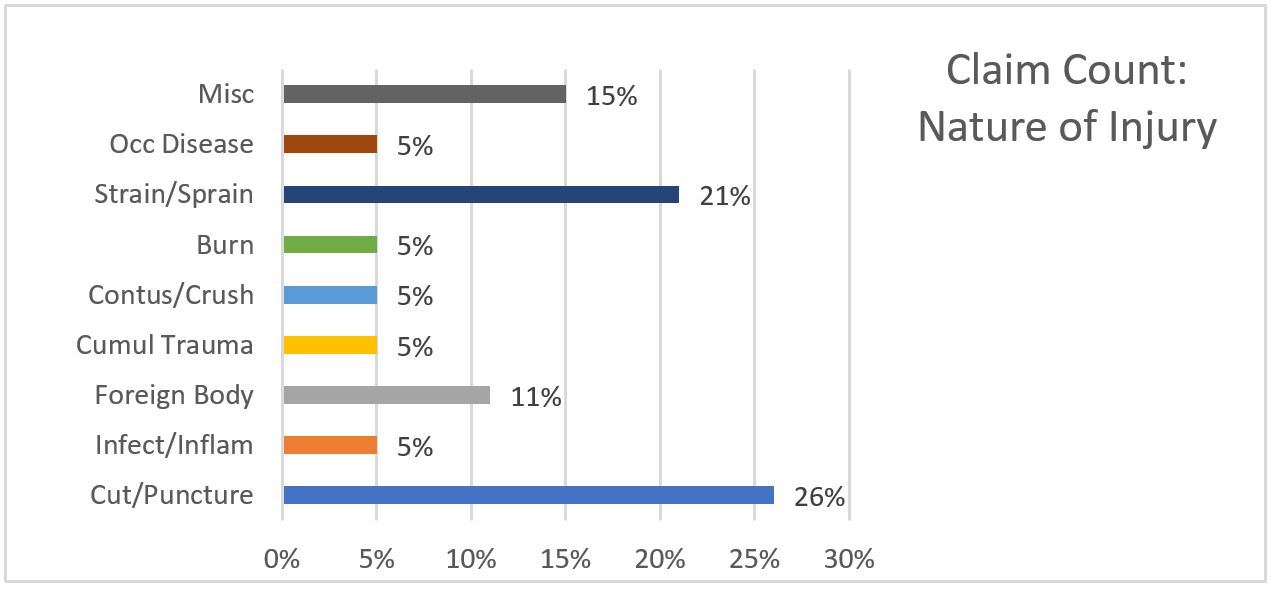
The graph above here shows us that the majority of our injuries were cuts/lacerations and strains/sprains.
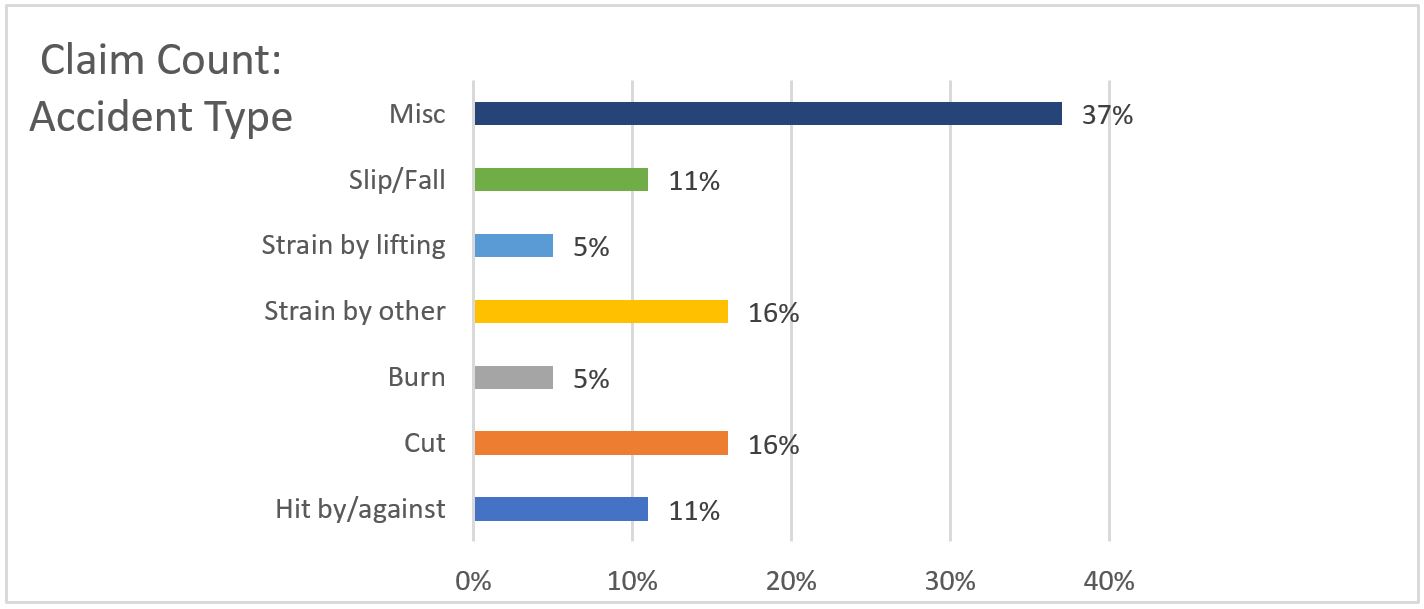
The most common accident types are illustrated in this graph. The miscellaneous types of injuries include: respiratory injuries, chemical burns, joint trauma, allergic reactions, and insect bites. The two most common injuries reported, that didn’t find a place under the miscellaneous section, were strains and cuts. At a glance, the information on this graph could easily be confused with that of the previous one. Look closely though and you’ll learn that the nature of an injury isn’t the same as an accident type. The accident type is what led up to the injury, and the nature of the injury is the injury that was sustained.
The keys to reducing the accidents within your department will be to identify the hazards and then apply the appropriate safety controls to prevent injuries from happening. For more information on hazard identification and control, contact the Safety & Risk Management office.
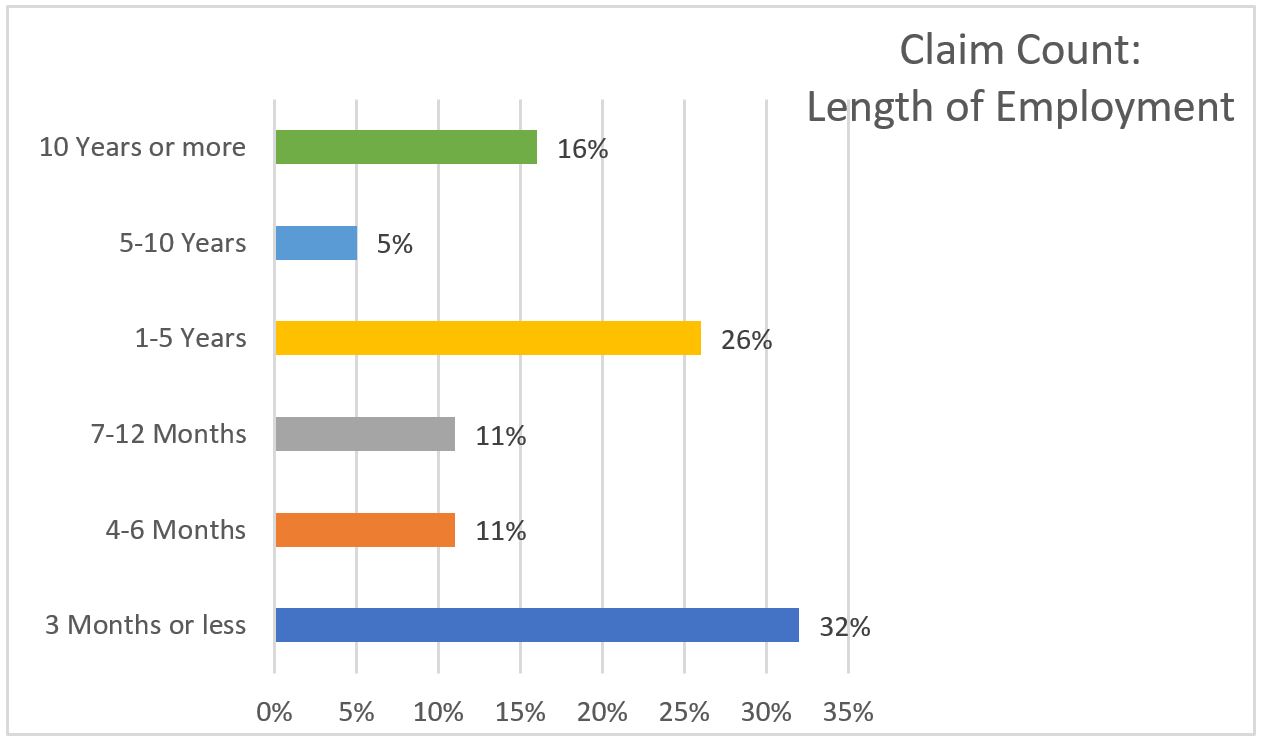
Differing from the other graphs, this one shows who, based on length of employment here at SUU, has been injured. We learn that the employees who had been working for 3 months or less are at a higher risk of being involved in an accident or injury. From this information we can assume that maybe there is a greater need to more effectively train new employees.
Does your department have a new employee safety training program? The SUU Safety and Risk Management office is dedicated to assisting campus departments establish meaningful new employee safety training. Contact our office for assistance today at (435)586-7901.
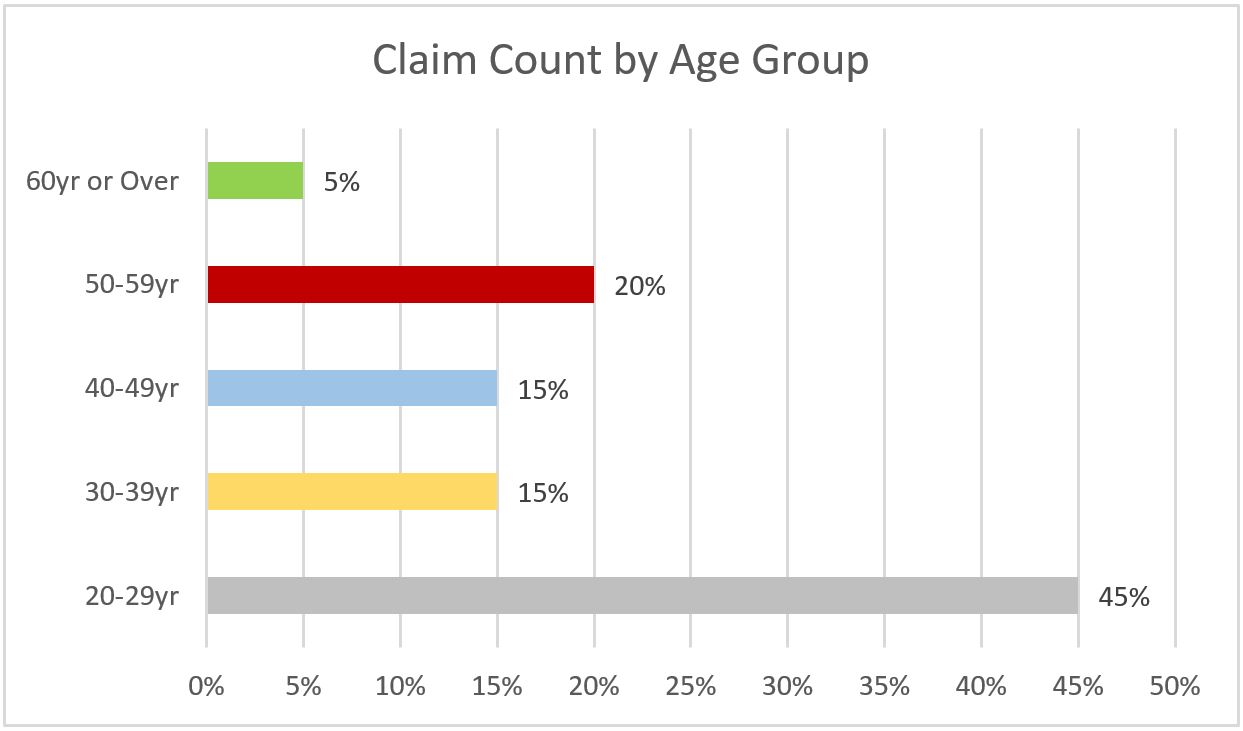
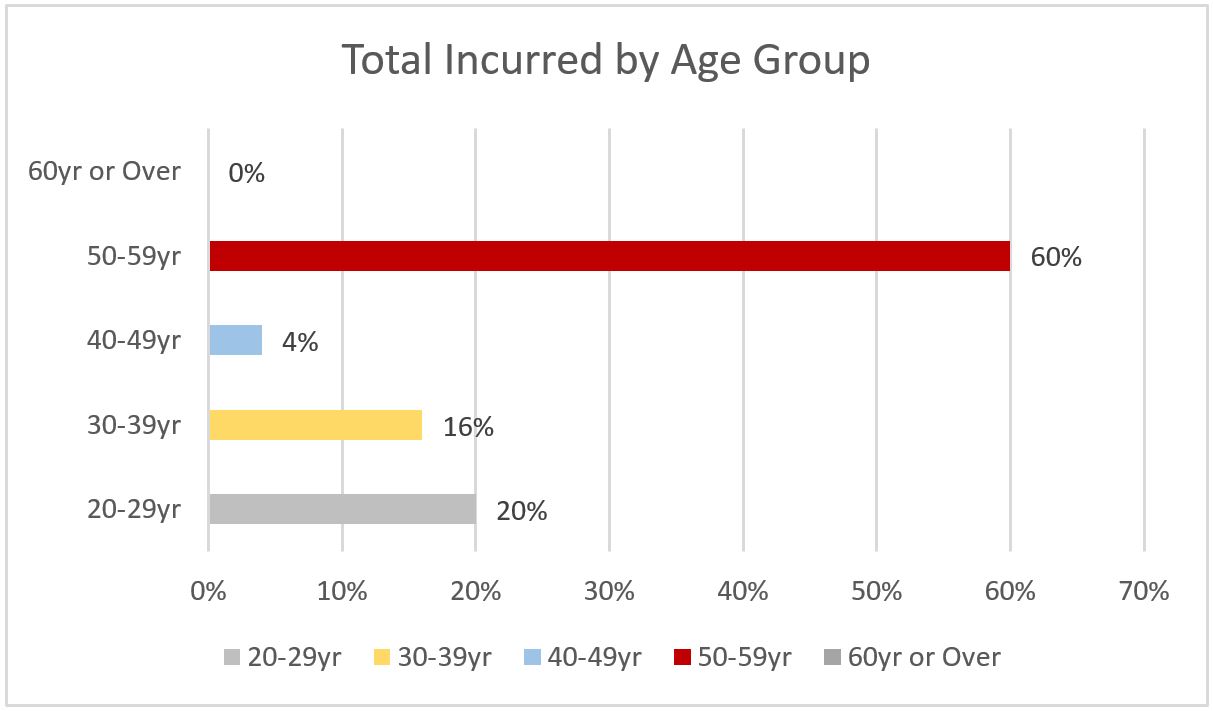
The graph above graph shows us the injuries based on age. Note that the age groups from 20-29 are at the highest risk for injury. However, the next graph shows us the percentage of cost incurred by age. Note that the group with the highest cost is the age group ranging from 50-59. This may indicate that the injuries are more severe for this age group as opposed to the others.
After reviewing the information in the graphs and understanding what they represent, it’s safe to say that there is room for improvement here at SUU. We hope that this report will help you to be more aware of the hazards that are associated with your job. Below you will find some safety tips that you can apply in your workplace to avoid some of SUU’s most common injuries. Thank you for helping us in our goal to create an Injury Free Campus. For assistance in developing a safety program for your department, please contact the SUU Safety and Risk Management office at (435)586-7901.
More resources and information for safety tips::