MPA Program Effectiveness
The MPA program is proud of its graduates! Alumni have accepted positions in all levels of government, nonprofit organizations, and in the private sector. Many graduates volunteer to become a member of our Advisory Council, thereby contributing to the long-term success of the program and the public service profession. The MPA faculty are committed to lifelong learning and often partner with our graduates on community activities, research projects, and other endeavors.
Our program has a diverse student body and our MPA alumni represent non-traditional and international students. Many of our current students work full time and our graduates represent several countries outside the United States.
The graduation rate is an important indicator of how efficiently students complete their degrees. The following table represents graduation rates for students over the past several years. The current data collection process does not allow us to distinguish between graduation rates for pre-service and in-service students. Pre-service students who enroll full-time can complete the program in two years, which is 100% of the time. In-service students, who often enroll on a part-time basis, may take longer than two years to complete the degree.
Program Statistics
Over the last 10 years an average of 80.4% of our students have Graduated from the program, and 91.6% of Graduates placed jobs. Many of our students go on to work in State or Local Governments.
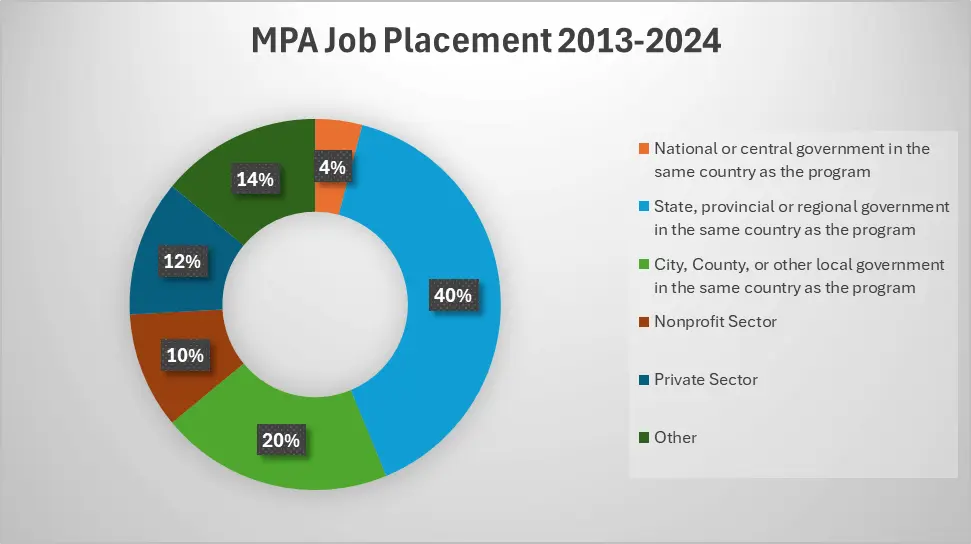
MPA Job Placement Pie Chart Text Version
| Job Placement Location | Percentage of Jobs |
|---|---|
| National or central government in the same country as the program | 4% |
| State, provincial or regional government in the same country as the program | 40% |
| City, County, or other local government in the same country as the program | 20% |
| Non Profit Sector | 10% |
| Private Sector | 12% |
| Other | 14% |
Persistence to Graduation
(based on the reporting year minus 5 years for actual cohort data)
| Reporting Year | Cohort Year (reporting year -5 years for actual data year) | Measure | Initial Cohort Group | 2-Year Graduation Rate | 3-Year Graduation Rate | 4-Year Graduation Rate | Total Students Graduated & Persisting to Graduation |
|---|---|---|---|---|---|---|---|
| 2024-25 | Fall 2019 (19-20 academic year) | Number of Students | 77 | 47 | 57 | 62 | 65 |
| % of All Students | 61.0% | 74.0% | 80.5% | 86.4% | |||
| 2023-24 | Fall 2018 (18-19 academic year) | Number of Students | 77 | 48 | 60 | 65 | 68 |
| % of All Students | 62.3% | 77.9% | 84.4% | 88.3% | |||
| 2022-23 | Fall 2017 (18-18 academic year) | Number of Students | 58 | 37 | 44 | 48 | 50 |
| % of All 2017-18 Cohort Students (ARY-5) | 63.79% | 75.86% | 82.75% | 86.20% | |||
| 2021-22 | Number of Students | 65 | 37 | 50 | 53 | 56 | |
| % of All 2016-17 Cohort Students (ARY-5) | 56.92% | 76.92% | 81.53% | 86.15% | |||
| 2020-21 | Number of Students | 53 | 23 | 33 | 37 | 41 | |
| % of All 2015-16 Cohort Students (ARY-5) | 43.39% | 62.26% | 69.81% | 77.35% | |||
| 2019-20 | Number of Students | 52 | 25 | 35 | 42 | 42 | |
| % of All 2014-15 Cohort Students (ARY-5) | 48.07% | 67.30% | 80.76% | 80.76% | |||
| 2018-19 | Number of Students | 43 | 16 | 32 | 33 | 35 | |
| % of All 2013-14 Cohort Students (ARY-5) | 37.2% | 74.4% | 76.7% | 81.4% | |||
| 2017-18 | Number of Students | 54 | 23 | 34 | 36 | 38 | |
| % of All 2012-13 Cohort Students (ARY-5) | 42.6% | 63.0% | 66.7% | 70.4% | |||
| 2016-17 | Number of Students | 37 | 14 | 23 | 24 | N/A | |
| % of All 2011-12 Cohort Students (ARY-5) | 37.8% | 62.2% | 64.9% | N/A | |||
| 2015-16 | Number of Students | 17 | 11 | 13 | 14 | N/A | |
| % of All 2010-11 Cohort Students (ARY-5) | 64.7% | 76.5% | 82.4% | N/A | |||
| 2014-15 | Number of Students | 26 | 18 | 20 | 21 | N/A | |
| % of All 2009-10 Cohort Students (ARY-5) | 69.23% | 76.92% | 80.07% | N/A | |||
| 2013-14 | Number of Students | 20 | 10 | 12 | 15 | N/A | |
| % of All 2008-09 Cohort Students (ARY-5) | 50% | 60% | 75% | N/A |
Job Placement Statistics
This table reports the job placement statistics of students who were employed within six months of graduation, by employment sector. The data provided are for the year prior to the annual program survey year (ARY-1), e.g. data for 2017-18 were reported in 2018-19.
| Sector per NASPAA report | Total graduates per year listed | ||||||||||
|---|---|---|---|---|---|---|---|---|---|---|---|
| 2023-24 | 2022-23 | 2021-22 | 2020-21 | 2019-20 | 2018-19 | 2017-18 | 2016-17 | 2015-16 | 2014-15 | 2013-14 | |
| National or central government in the same country as the program |
4 |
0 | 3 | 1 | 4 | 1 | 2 | 1 | 1 | 1 | 1 |
| State, provincial or regional government in the same country as the program | 17 | 23 | 11 | 18 | 24 | 22 | 18 | 19 | 13 | 12 | 7 |
| City, County, or other local government in the same country as the program | 12 | 18 | 13 | 12 | 8 | 8 | 7 | 1 | 7 | 7 | 1 |
| Government (all levels) or international quasi-governmental | 0 | 0 | 0 | 0 | 0 | 0 | 0 | 0 | 0 | 0 | 0 |
| Nonprofit domestic-oriented | 4 | 6 | 8 | 3 | 3 | 7 | 3 | 6 | 0 | 3 | 4 |
| Nonprofit/NGOs internationally-oriented | 0 | 0 | 0 | 1 | 0 | 0 | 0 | 0 | 0 | 0 | 0 |
| Private Sector - Research/Consulting | 1 | 0 | 0 | 1 | 3 | 0 | 1 | 0 | 0 | 0 | 1 |
| Private Sector but not research/ consulting | 5 | 4 | 9 | 1 | 9 | 10 | 3 | 2 | 1 | 2 | 2 |
| Obtaining further education | 2 | 1 | 0 | 3 | 1 | 1 | 2 | 1 | 2 | 1 | 0 |
| Military Service | 0 | 0 | 0 | 0 | 0 | 0 | 0 | 0 | 0 | 0 | 0 |
| Unemployed (not seeking employment) | 2 | 0 | 0 | 2 | 2 | 2 | 0 | 1 | 0 | 2 | 0 |
| Unemployed (seeking employment) | 0 | 0 | 0 | 0 | 3 | 1 | 0 | 1 | 2 | 1 | 2 |
| Status Unknown | 2 | 5 | 1 | 3 | 0 | 3 | 2 | 3 | 3 | 4 | 4 |
| Total | 49 | 57 | 45 | 45 | 57 | 55 | 38 | 35 | 29 | 33 | 22 |
Job Placement Rates
| Year | 2023-24 | 2022-23 | 2021-22 | 2020-21 | 2019-20 | 2018-19 | 2017-18 | 2016-17 | 2015-16 | 2014-15 |
|---|---|---|---|---|---|---|---|---|---|---|
| Placement Rate | 96% | 100% | 100% | 96% | 91% | 100% | 88.6% | 87.5% | 97.0% | 85.0% |